
On August 11, 2026, we conducted an important experiment in which two bags of crushed ice (20kg per bag, totaling 40kg) purchased from a wholesale market were used instead of a heat pump to cool approximately 1,700 liters of soap solution down to a minimum temperature of 5°C. We observed the impact this had on the cavity temperature, particularly on indoor air temperature and humidity.
The experiment was actually carried out twice. In the morning, after adding the ice, we first performed Liquid Cooling test within the cavity. However, when preparing for the next step — filling the cavity with soap bubbles — we discovered that the pump supplying soap liquid to both the south-side liquid cooling system and the entire soap solution circulation had failed (it had been in use for one year). As a result, we had to purchase a new pump and repeat the experiment in the afternoon. After adding another two bags of ice, we first filled the cavity with soap bubbles and then proceeded with the spraying. The resulting data curves provided valuable insights, which we will now analyze for you. If you prefer not to read the text analysis or view the data curves, please scroll to the end to watch the video.
To help readers better understand the data curves, we have included below the 24-hour temperature and humidity data recorded from midnight to midnight on August 6, 2026. During this period, no action was taken in the cavity — neither filling with soap bubbles nor spraying for cooling — representing a typical “passive” solar scenario. The resulting temperature and humidity curves are shown as follows:
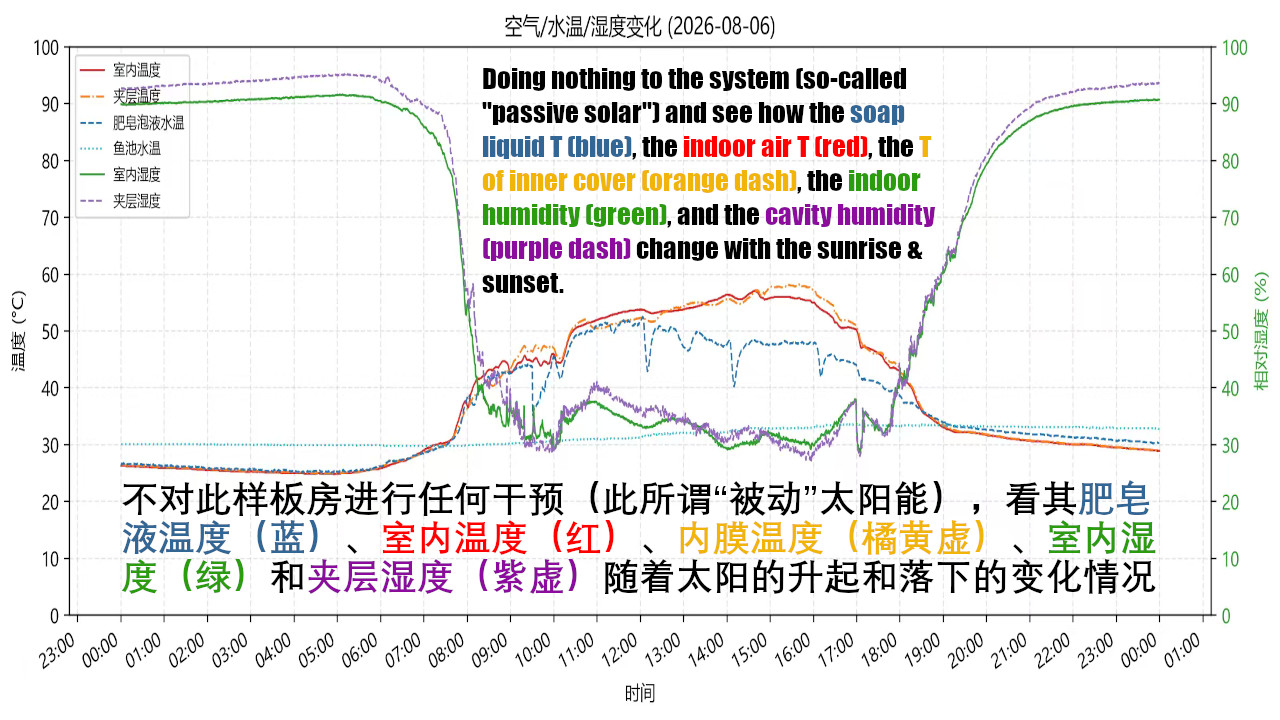
From the red line representing indoor air temperature, the orange dashed line indicating the cavity temperature (which can also be understood as the inner cover temperature, since the measuring probe is close to the inner cover), and the green dashed line showing the water temperature of the soap solution, we can observe that after sunrise, all three temperatures rise noticeably. The indoor air temperature and the inner cover temperature remain nearly synchronized, while the soap solution’s temperature remains significantly lower than both.
Additionally, examining the purple dashed line representing cavity humidity and the green solid line depicting indoor humidity, we see that these two curves are closely aligned. Humidity is high when temperatures are low (indicating that the hottest area at night is located at the bottom, with moisture resulting from evaporation), and humidity decreases when temperatures rise (suggesting reduced moisture content in both the indoor space and the cavity).
With these basic data curves established, let us now examine how the system responds when ice is first added to the soap solution, and this relatively colder soap solution is then sprayed in the cavity:
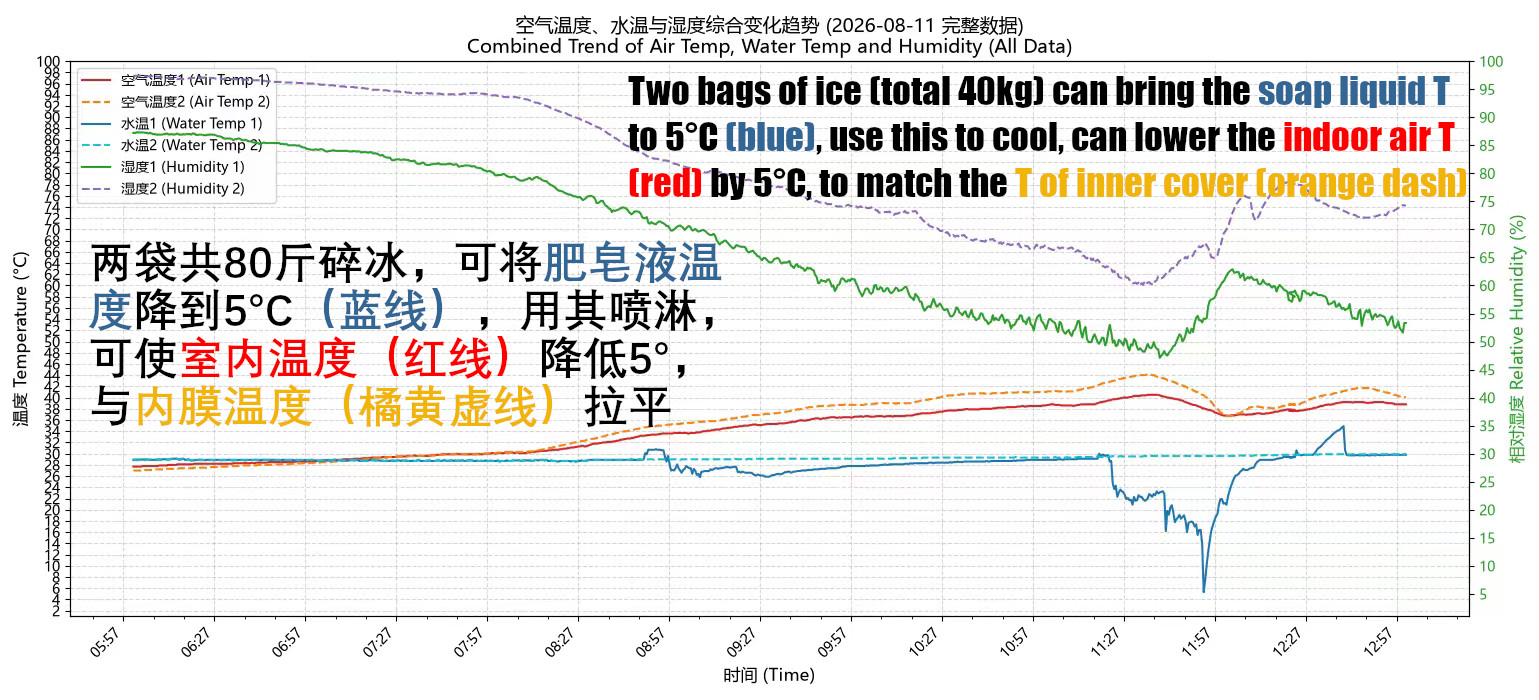
Clearly, as the ice dissolved in the soap solution, the temperature of the solution continuously decreased until it reached 5°C, at which point it stopped dropping and began to rebound, gradually rising again.
The data curve clearly shows that when the water temperature of the soap solution was decreasing, apart from the fish pond temperature (green dotted line), which remained largely unaffected, both indoor air temperature and the cavity temperature also dropped, while humidity levels in both the indoor space and the cavity increased accordingly.
After replacing the broken pump in the afternoon, allowing liquid to be supplied to the foam generator, we repeated the experiment. We purchased two more bags of crushed ice and added them to the soap solution tank. This time, we first activated the system to fill the cavity with soap bubbles, and only after the cavity was completely filled did we start the liquid cooling process for a short time. The resulting curve is shown below:
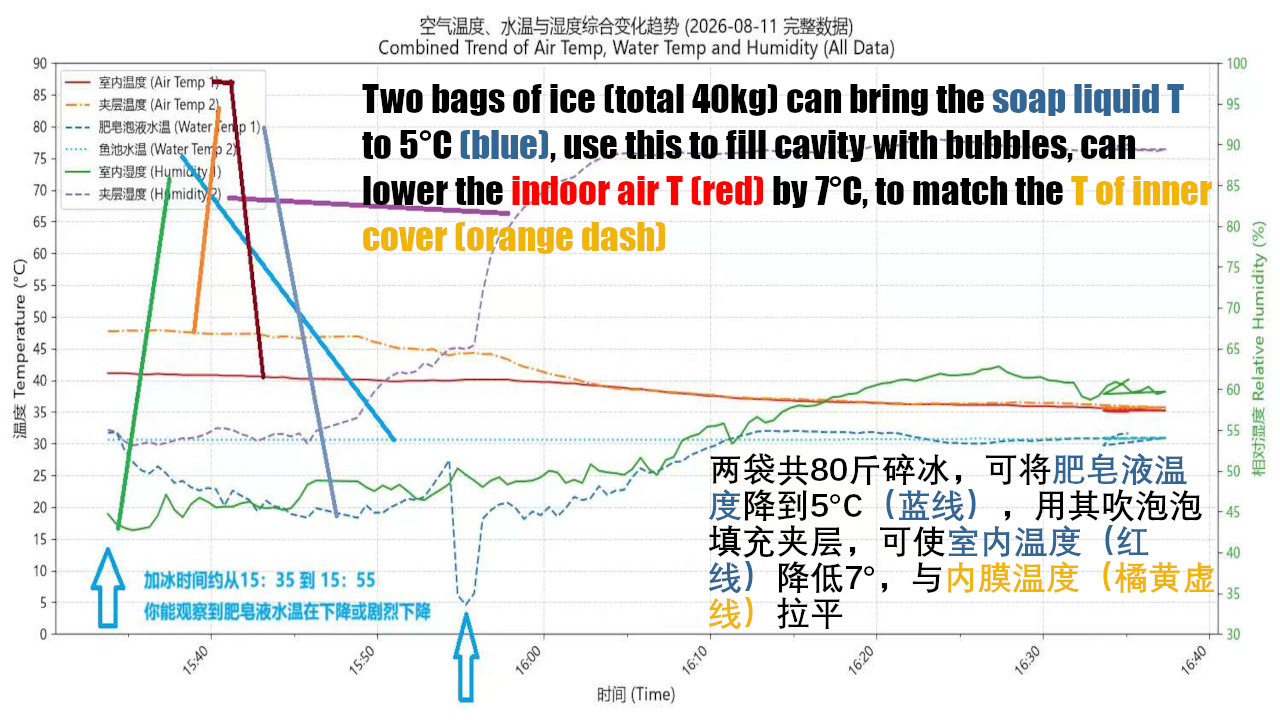
This second experiment shows that after adding crushed ice to the soap solution, both indoor air temperature and cavity temperature begin to drop as the soap solution cools, with the cavity temperature decreasing more significantly. Moreover, from the two humidity curves, it can be observed that although the humidity in the cavity rises rapidly and reaches 90%, the indoor humidity increases only slightly and remains below 42%. This may explain why no condensation forms on the inner surface of the membrane facing the interior.
When the two ice-adding experiments are combined and plotted starting from sunrise, the resulting curves are as follows:
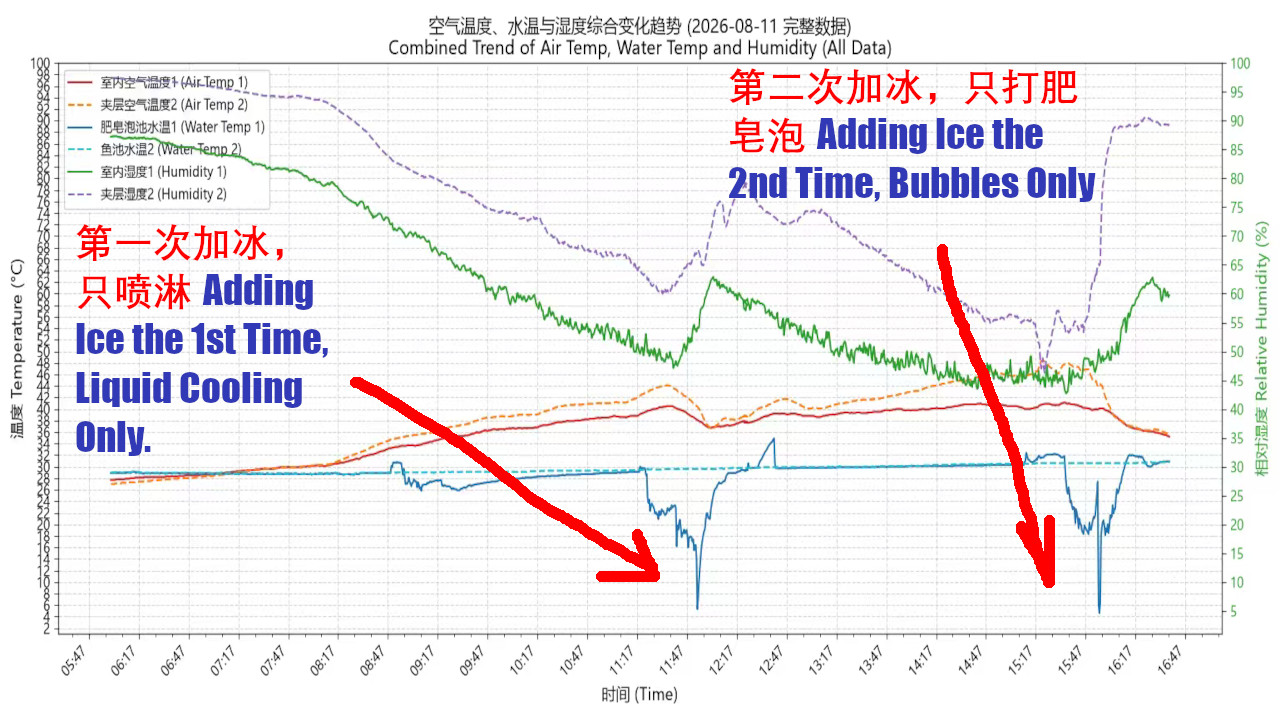
Based on the data from these two experiments, whether by spraying soapy water into the cavity to cool or by filling the cavity with soap bubbles for cooling, both methods achieved the desired effect indoors: not only did they lower the temperature, but they also increased indoor humidity to some extent — both of which are clearly beneficial for indoor cultivation and breeding.
From these two simple experiments, we can make a preliminary prediction: if a heat pump is used to continuously maintain the temperature of the soapy water within a suitable range — say around 15°C — it may be possible in such a greenhouse to regulate indoor air temperature to approximately 20°C and humidity to about 50% by controlling the temperature of the soapy water—a climate ideal for the survival of all living organisms.